Azure Update Management - Part 6 - Monitoring
Hello there, the goal of this serie is to describe a real world implementation of Azure Update Management. This service was designed to update any machine in your infrastructure, whether they are hosted on Azure or elsewhere, provided your OSs are technically supported.
In order for every reader to understand and find answers to their need, to I’ll try to give a comprehensive feedback from my experience, as well as sharing tips about design and architecture, automation, effectivement, troubleshooting issues, and so on!
Have a nice reading.
Plan
- Part 0 - Introduction
- Part 1 - Architecture
- Part 2 - Azure Policy
- Part 3 - Azure ARC
- Part 4 - Log Analytics agents
- Part 5 - Automation accounts
- Part 6 - Monitoring (you’re here)
- Part 7 - Security patches on Azure ARC
- Part 8 - Security patches on CentOS machines
Purpose
In this article, I assume you connected all your virtual machines. What you may want now is monitoring you virtual machines. The usual way to monitor updates is navigate to the automation account, then take a look at your VMs.
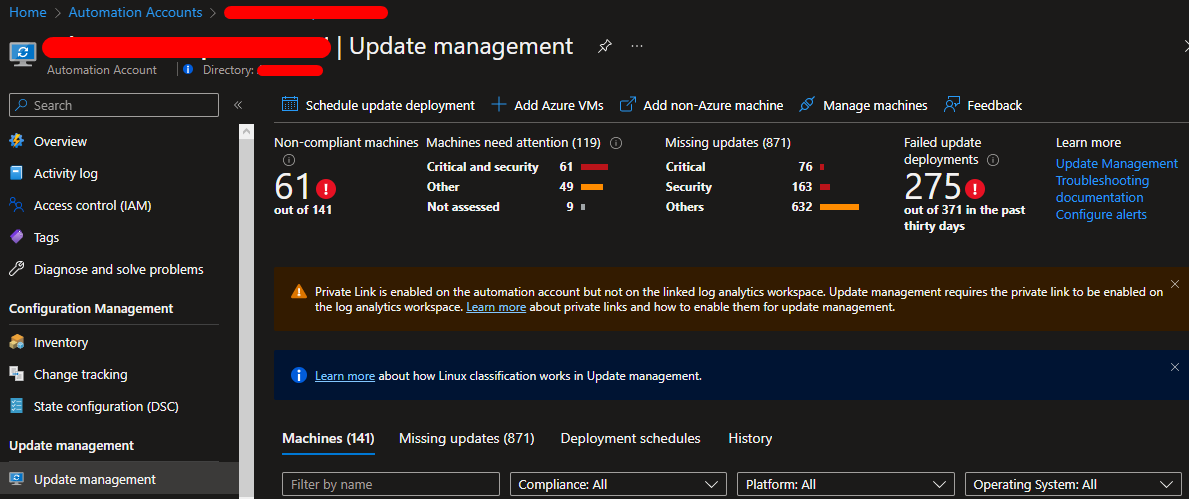
This is a very poor view, and we sure can do way better! And I actually developed a ready to use monitoring workbook that you need to slightly tweak to meet your needs. Ready to discover that sick workbook? Here is a short video.
Deploy
To get the same awesome dashboard, just copy the code hosted on my Github, and follow these steps :
- Create a new workbook
- Edit the workbook and select the advanced editor (gallery template)
- Paste the code
- Save
You should end up with something that looks like this. Let’s adapt this to make it work.
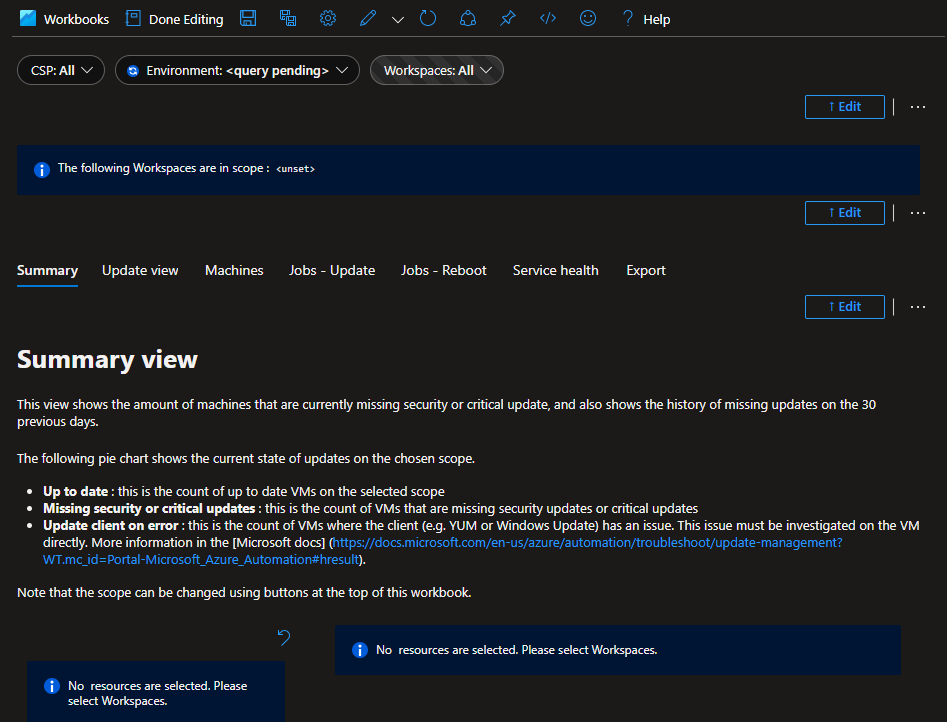
Adapt
Customize general filters
The goal of this section is to show how to create filters button so that you can customize them. In my case, the update management architecture is made of the of multiple Log Analytics workspaces that collect VMs update data. In order to monitor data only on those Log Analytics workspaces, we tag them with the tag application:update management to that we can filter them. Then we also add the following tags to our log analytics based on their CSP and their environment. This is summed up in the following table.
| Log Analytics name | Second priority | CSP tag | Environment tag | Application tag |
|---|---|---|---|---|
| loga-azure-001 | Azure | azure | prod | update management |
| loga-oci-001 | Azure | oci | prod | update management |
| loga-gcp-001 | Azure | gcp | prod | update management |
| loga-ovh-001 | Azure | ovh | prod | update management |
| loga-np-azure-001 | Azure | azure | no prod | update management |
| loga-np-oci-001 | Azure | oci | no prod | update management |
| loga-np-gcp-001 | Azure | gcp | no prod | update management |
| loga-np-ovh-001 | Azure | ovh | no prod | update management |
Once this has been done, let’s create our filter buttons by editing and add Add links/tabs.
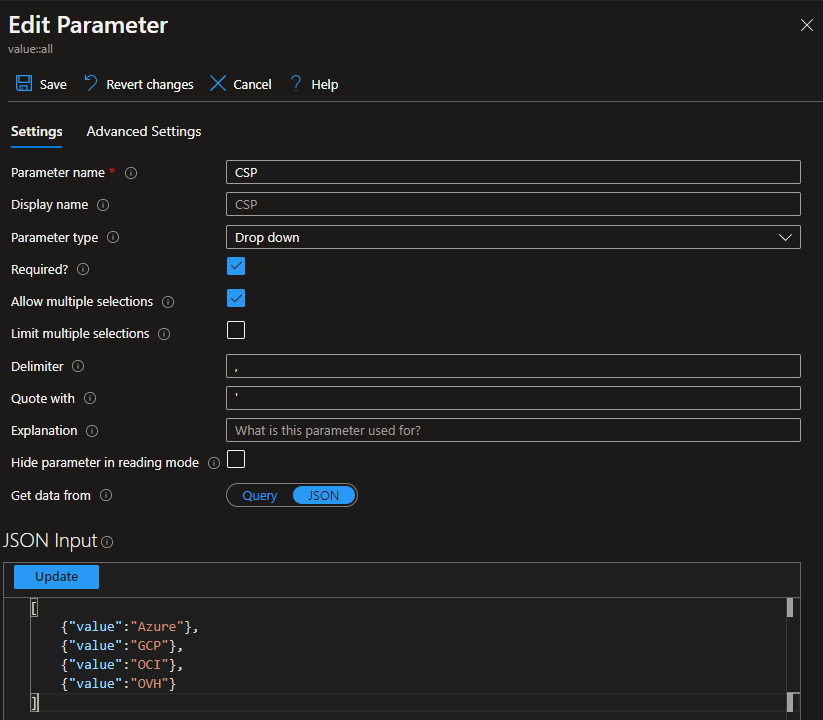
Create a first parameter named CSP
This will create a drop down button where we can select the different CSPs where our VMs are deployed, in order to filter our view by CSP.
- Make it a drop down
- Make it a required parameter
- Allow multiple selection
- Set a static JSON and save
Create a first parameter named Environment
This will create a drop down button where we can select the environment (prod, no prod) in order to filter our view by environment.
- Make it a resource picker
- Make it a required parameter
- Allow multiple selection
- Set the query as shown on the screen shot
This request selects all Log Analytics workspaces that have the tag application:update management, and returns the list of all unique environment tags positionned on these Log Analytics.
where type =~ 'microsoft.operationalinsights/workspaces'
<td>where tolower(tostring(tags.application)) == "update management"
<td>distinct tostring(tags.environment)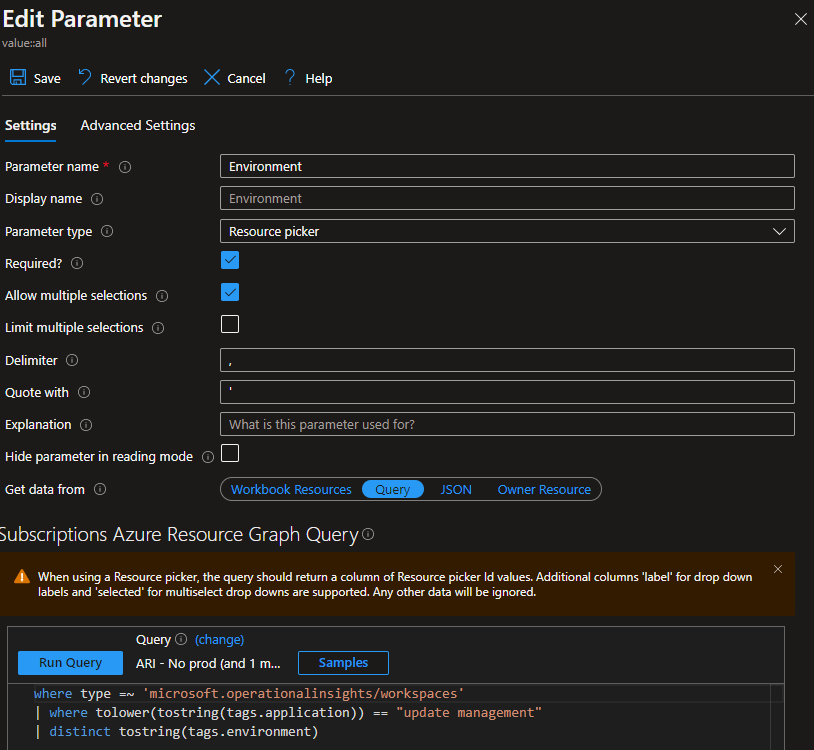
Create a first parameter named Workspaces
The selected values in our two previous buttons will make this third and last button to return different values.
- Make it a resource picker
- Make it a required parameter
- Allow multiple selection
- Check the “Hide parameter in reading mode” feature
- Set the query as shown on the screen shot
This request selects all Log Analytics workspaces that have the tag application:update management, and return all Log Analytics workspaces that have CSP tag and Environment tags that matches the selection we made using the previous buttons.
where type =~ 'microsoft.operationalinsights/workspaces'
<td>where tolower(tostring(tags.application)) == "update management"
<td>distinct tostring(tags.environment)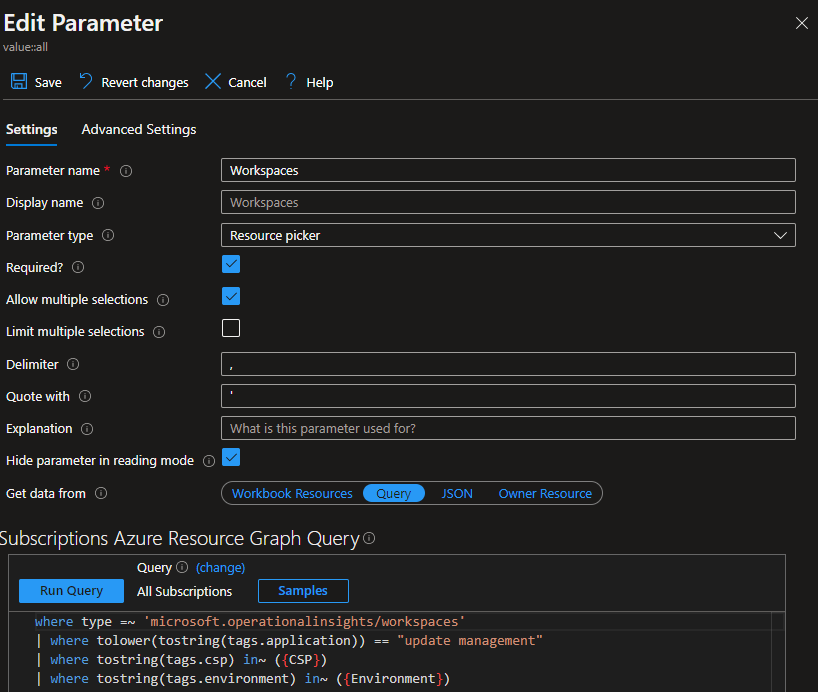
If you didn’t change too much things, the result for this first step should look like this.

Customize job filters
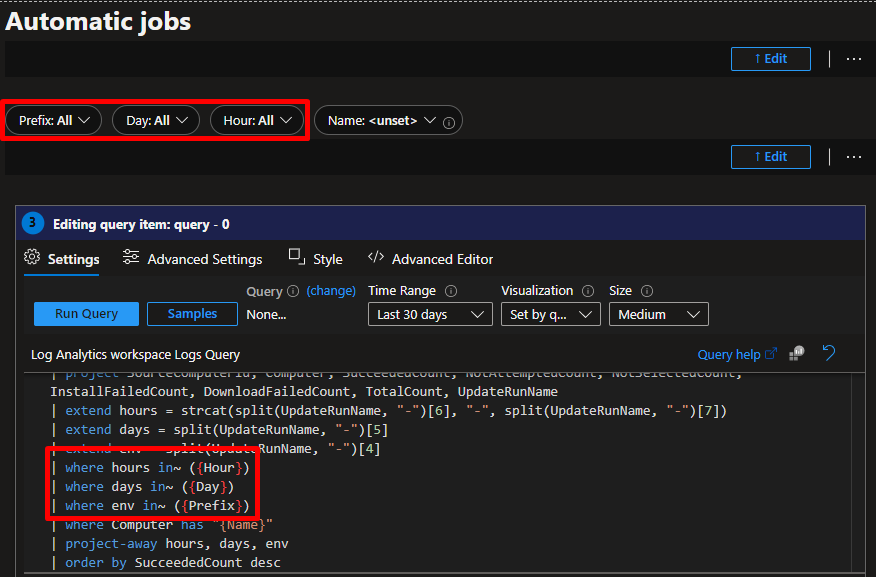
In my case, VMs have specific tags to easily know when they are supposed to update and reboot. For instance, a production machine (P) that updates and reboots on wednesday (WED) at 12:00 (12:00) will be tagged with patch:P-WED-12:00. Because I have a lot of machines, I wanted to filter the jobs so that I can observe the jobs of all machines that updated on a specific day, or a specific hour.
Based on your needs, you either remove or adapt what is highlighted on the following screenshot.
Additional info
So what do we have to monitor our VMs? Our VMs send the followinf logs, thanks to the Log Analytics agent that are runnin on them:
- The Update table represents updates available and their installation status for a machine. This is table we will mainly use.
- The UpdateRunProgress table provides update deployment status of a scheduled deployment by machine. It will show the status of update deployments i.e. whether it was successful or not.
- The UpdateSummary table provides update summary by machine. This is some sort of agregrate of the Update table.
You can find some query examples using these tables in the Microsoft documentation.